PWX DISCOVER
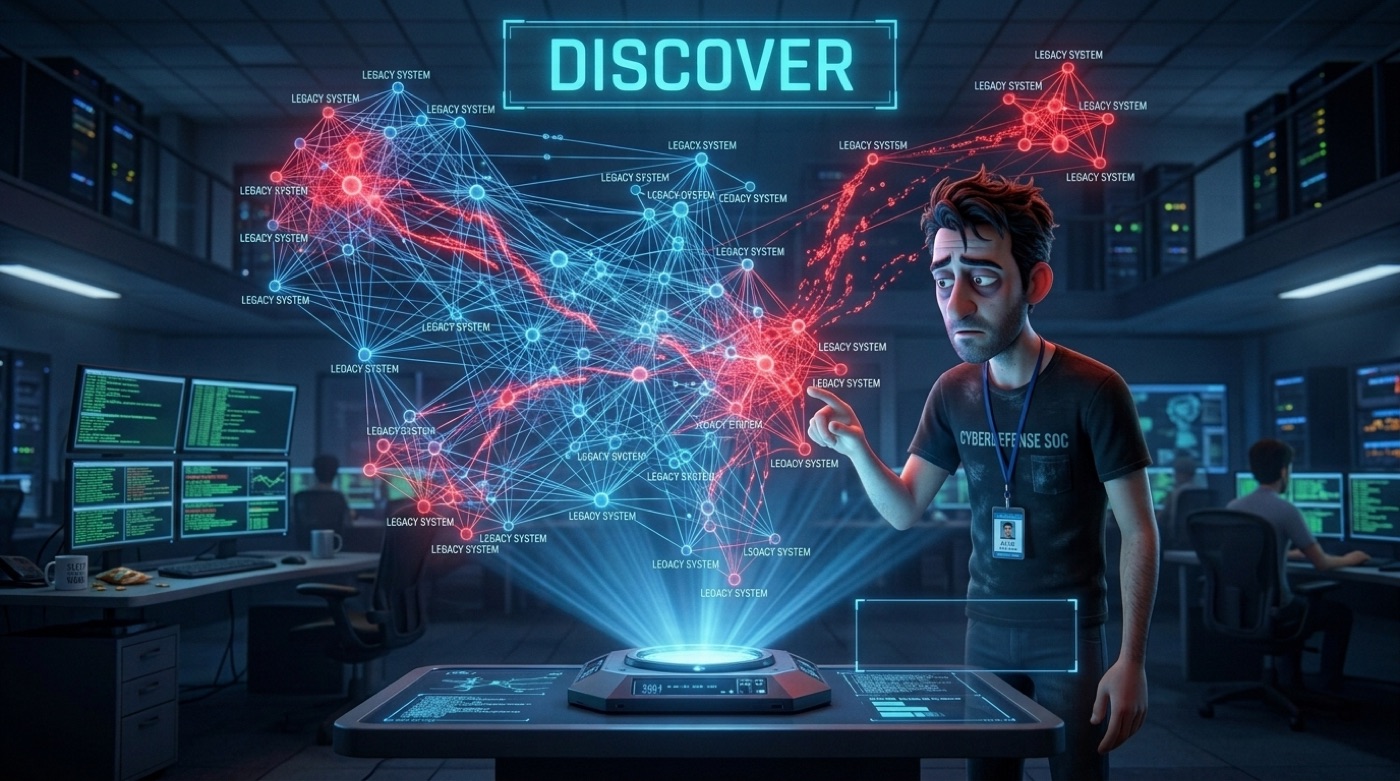
Nothing installed on your servers. One host, read-only: on day one you have the attack surface mapped across the entire fleet, and what already looks wrong in it.
 BareketAI PWX
Nothing installed on your servers. One host, read-only: on day one you have the attack surface mapped across the entire fleet, and what already looks wrong in it.
PWX Monitor watches the fleet, still agentless, and alerts into your SIEM, from PWX Cloud or on-prem. Where you need milliseconds, the PWX-01 agent runs on the BMC of 2–5 lab servers and records every verdict it would have delivered. It changes nothing. You read three or four weeks of that record on your own workload.
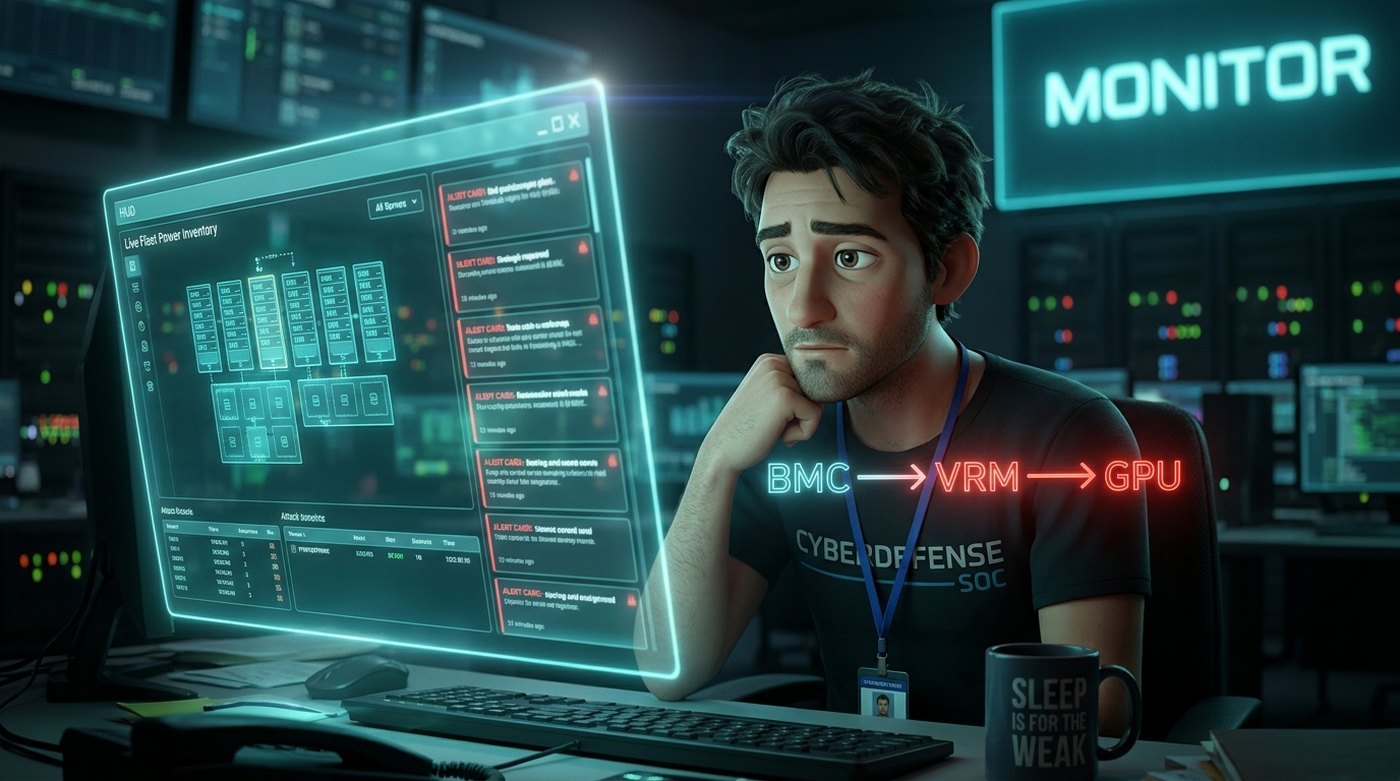
Only when the record is clean do you turn PWX Protect enforcement on. A verdict carrying physical evidence reaches your orchestration and your policy engine, and acts under the authority you set and can revoke.

Each step has a condition agreed before the previous one starts.
Nothing installed. Nothing changed. Nothing rebooted. On day one you see the attack surface across your entire fleet; within a week, what stands out in it.
We connect, we watch, and at the end of the week you get a list of what is actually wrong in your fleet. Not what could go wrong. What is.
3,200 servers mapped
3 showing drift outside the fleet norm
1 running firmware nobody approved
41 where the management controller answers from the workload network
Illustrative. Every report is generated from the customer's own fleet.
We run the console for you. Your site connector pushes inventory and alerts out, egress-only, to your own isolated tenant.
The same control plane in your own cloud account, under your keys and your retention.
One binary or container on your own server. No external database, nothing phones home.
Hand over one static binary. It runs on disconnected networks without change.
Defending the power layer continuously across a fleet produces measurement at a scale no observability platform should ever be asked to store. PWX keeps that volume where it belongs, analysed locally, on your own infrastructure, and forwards only what a person needs to act on. Your SIEM receives findings, not firehose.
The heavy work happens next to the hardware. Only findings travel, to your SIEM or your own PWX Cloud tenant
Your existing tools receive what matters, at a volume they were designed for
Full-resolution history stays local for as long as you want it, and no longer
Straight answers, in the order they usually come up. Anything not covered here, ask us directly during the pilot conversation.
PWX Discover and PWX Monitor install nothing on your servers: one host in your management network reads them through Redfish, SNMP and the GPU telemetry you already export. Only the PWX-01 agent, for millisecond detection, runs on the servers, at the management layer, the BMC plane, not your operating system. It samples power controllers at up to 100 Hz and analyses locally. Nothing is added to your application stack.
No. PWX Monitor only alerts, and the PWX-01 agent starts in record-only mode and changes nothing. Enforcement stays off until weeks of recorded would-be decisions are clean on your own workload, and a verdict then acts in your existing controls, under policy you set and can revoke. PWX does not act on its own authority.
Machine telemetry only: voltages, currents, temperatures, protocol commands. No workload content, no customer data, ever.
Yes. PWX runs fully inside your environment, including disconnected networks. PWX Cloud, our hosted console, is optional: nothing depends on it, and no telemetry has to leave your site.
Findings, not firehose. The heavy analysis happens where the measurement is made; your monitoring platform receives findings, verdicts and evidence at a volume it was designed for. Full-resolution history stays local, with retention you control.
On-prem, PWX runs inside your environment with no inbound access from us. With PWX Cloud, your site connector pushes out over an egress-only, per-site token, and we still have no way in. It observes the power layer rather than trusting what that layer reports about itself, keeps a record designed to survive an incident, and its enforcement authority belongs to you, a switch you set and can revoke.
Segmentation reduces exposure; it does not remove the surface. A compromised administrator or firmware component acts from inside the perimeter, beneath SIEM and EDR visibility. PWX detects on how the power layer actually behaves, not on where the perimeter is.
PWX Discover and PWX Monitor read standard interfaces: Redfish, SNMP, dcgm-exporter and NVIDIA NVML. The PWX-01 detection engine is bus-agnostic by design: validated on I²C, architected to detect identically on PMBus, the transport the installed base runs on. Fleet-specific bring-up is part of the pilot, on your own or production-identical hardware.
One place for every commitment PWX makes about data and authority. Designed for defence, government and national infrastructure environments.
No workload content, no customer data, ever.
The heavy work happens next to the hardware. Only findings travel, to your SIEM or your own PWX Cloud tenant.
Full-resolution history stays local for as long as you want it, and no longer.
Runs fully inside your environment, including air-gapped sites.
Enforcement acts under policy you set and can revoke.
Your existing tools receive what matters, at a volume they were designed for.